Why does the cost of capital vary so widely from one business to another? It’s all about risk.
How does a company raise finance – and at what cost? To answer that, take two of America’s best known companies. In October 2021, retail chain Walmart had a market capitalization of almost $390 billion. Elon Musk’s electric car and renewable energy brand, Tesla, was valued at $777 billion. Yet at the same time, Walmart was estimated by Bloomberg to have a weighted average cost of capital (WACC) of 5.8%, with Tesla’s estimated to be 16%. Despite being the more valuable company, Tesla’s access to finance cost it almost three times as much as Walmart’s. Why does this metric vary so greatly, and what can leaders do to better understand what the market is saying?
Most people understand the concept of return on investment (ROI) intuitively. But they struggle when it comes to understanding the concept of cost of capital, also known as hurdle rate.
Understanding risk
In finance, losing money is not risky. If you expect to lose money and then you lose money, there is no risk in that. But if you expected to lose money and then you made money – that is risk. In finance, risk is surprise. It is variance. Mathematically, it is standard deviation.
We can plot out the distribution of a range of outcomes for a decision or an investment. This can often look like a bell curve (although it doesn’t have to). How wide is the distribution of outcomes? That is the risk.
To define risk in the markets, academics looked at historical data for different types of investments. Let’s take just two types – the distribution of the performance of the S&P 500 index annually over 90 years, and the distribution of the performance of investments in three-month US Treasury bills. For the S&P 500, some years an investor would have made 30%; some years, lost 30%. Most of the time, the return was between 0-10%.
In contrast, during the same 90-year period, if you invested in the treasury bills, you never lost money, and you always made a small return. The distribution of returns was narrow and positively skewed. The academics found that the wider and more uncertain distribution of returns from stocks as compared to bonds was riskier.
This is why we have the concept of risk premium – an annual rate of interest that you should be rewarded for taking on higher levels of uncertainty. More uncertainty means more risk and higher expected rates of return – although, if you take on too much risk, we (the investors) may not want to invest at all. When looking at a company’s hurdle rate or cost of capital, you are viewing the annual rate that investors expect to be paid for the level of uncertainty presented by that company.
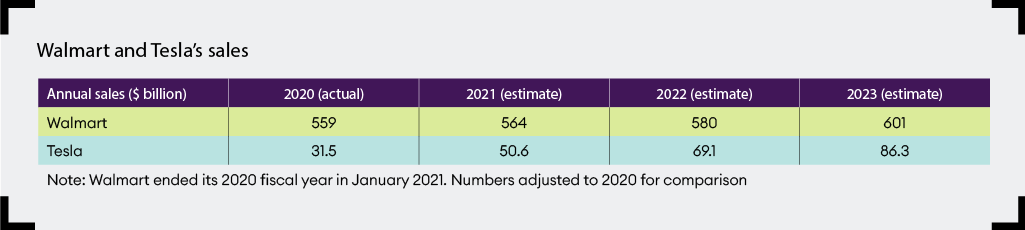
Walmart and Tesla
Let’s go back to our example of Walmart and Tesla, and start with predictions for each company. Walmart is a predictable business. In its fiscal year 2021, which ended in January 2021 (essentially 11 months of 2020), it had $560 billion in annual sales. By 2023, it is expected to grow to approximately $601 billion in sales, at a rate of 1-4% annually. These numbers represent consensus estimates based on the average of the guesses of the professional sell-side analysts surveyed by Bloomberg.
What is interesting is the range of those estimates. For the 2023 forecast, Bloomberg is averaging 14 guesses with a high of $621 billion and a low of $582 billion in sales. The average is $601 billion. In essence, it is wisdom of the crowd – a very well-informed professional crowd – applied to estimating the future. Critically, in estimating Walmart, there are likely to be few surprises. In a good year, Walmart may grow 4%; a bad year might be 1% growth. Even amateur investors could forecast Walmart’s growth rate with a low margin of error. It is predictable and stable.
This is in sharp contrast to Tesla. In 2020, Tesla reported sales of $31.5 billion; it is expected to sell $86.3 billion by 2023, based on that same approach by Bloomberg. But we have to look more closely at the range for 2023. Bloomberg took the average of 34 analyst guesses, with a high of $127.3 billion and a low of $57.6 billion. The average expectation is that Tesla will almost triple in size – but there is no unanimity in this belief. Some feel Tesla is going to the moon, while others have a much more tempered view of growth.
A financial interpretation of the above data is that Tesla is much more risky than Walmart. To compensate for the added uncertainty, investors expect to earn a better return – as reflected by the higher hurdle rate of 16%. For the more predictable Walmart, investors should expect to earn a lower rate of return.
One hurdle rate is not necessarily better than the other – it is simply a function of the level of uncertainty. Investors can then apply their risk tolerance and decide whether the likely cost and benefit make investing worthwhile.
Management lessons
If leaders are trying to understand the hurdle rate of any investment, they should begin with the level of certainty and think about what the distribution of outcomes could look like. That is the first step in understanding and communicating the risk.
If a company is trying to lower its hurdle rate, then it needs to think through options to reduce the volatility of potential outcomes in its business, and identify what it can do to alter the distribution of those outcomes. At a minimum, by thinking through the ranges, leaders will get a better understanding of the risk associated with a project, and, ultimately, insight into whether a lower or higher hurdle rate would be required.